In this page I outline my thoughts, analysis and trade plan for the next trading day. This page is updated daily Sunday-Thursday.
Monday, July 1st, 2024:
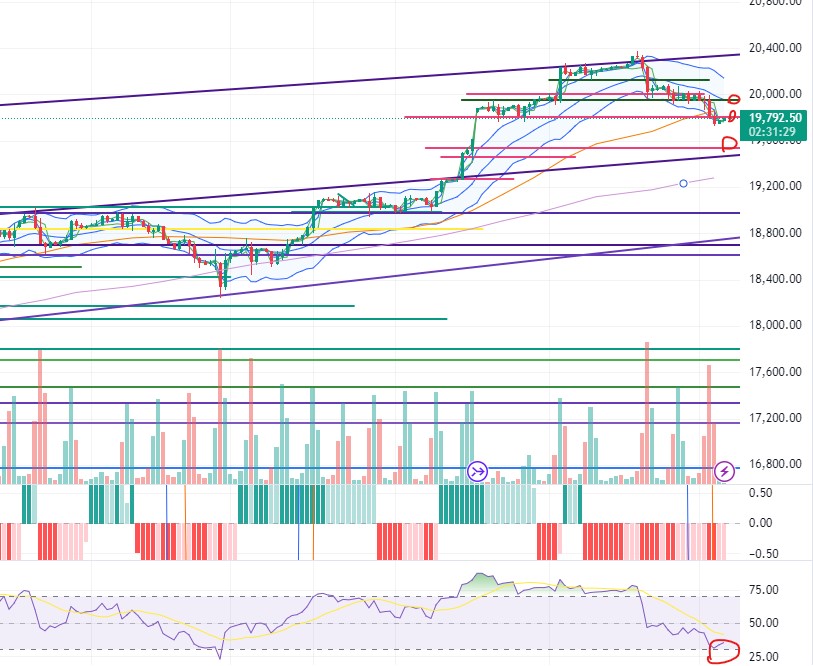
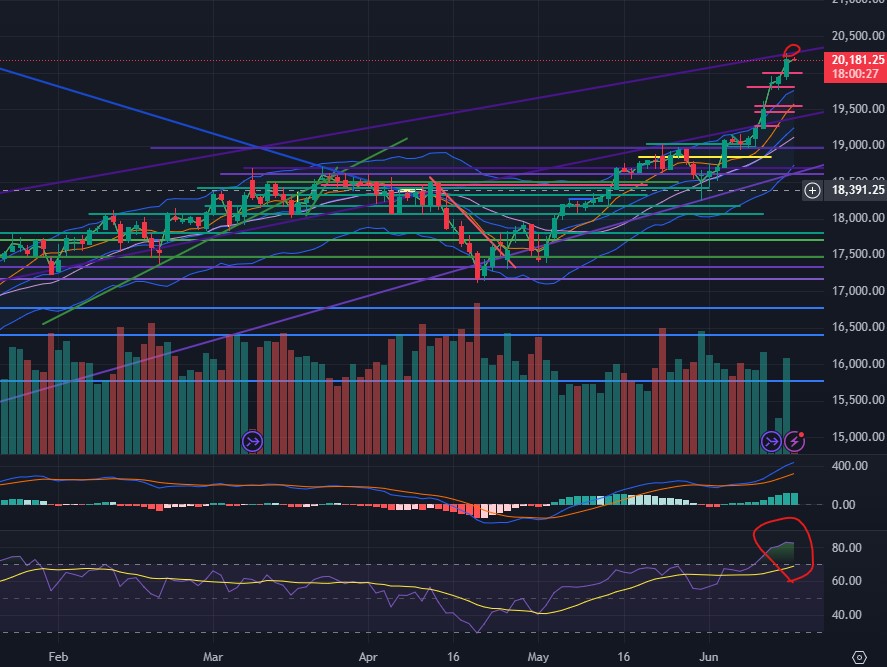
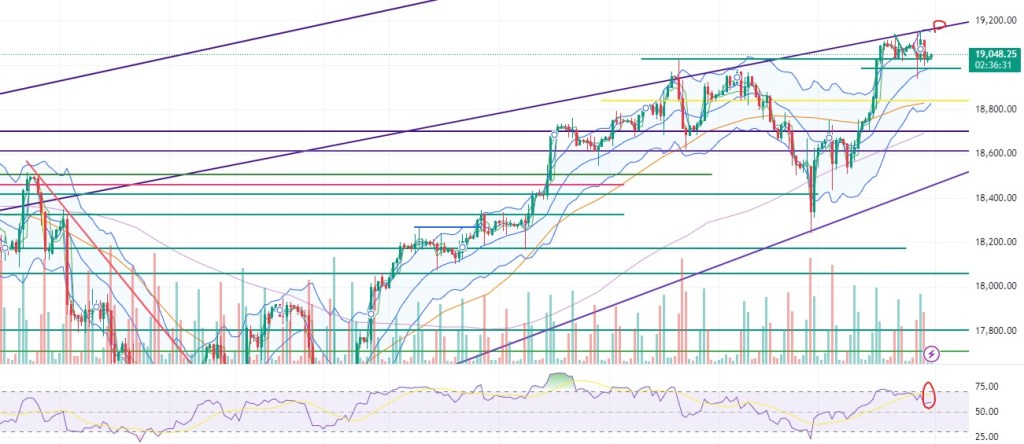
Today, the market broke below the $19,950 level before rejecting the $19,800 level and closing green at $20,049. NQ seems to be trading in a range between $20,275 and $19,700. The open-to-close volatility has been decreasing based on my Volatility Tracker. This might signal that it is a good time to trade reversals of any large intraday moves, as the distance from open to close prices has been coming down lately for NQ. NDX is now trading above its 9-day MA again. Both NDX and NQ are still close to overbought on the daily chart RSI.
NVDA dropped more than 3% early in the morning before recovering and ending the day green. NVDA still remains below the $125.50 resistance level. NVDA is still below its 9-day MA and is now touching its 21-day MA. A bearish MA crossover is closely approaching for NVDA, which is normally a bearish trend signal. AAPL closed up almost 3% today and is now above its 9-day moving average again. MSFT broke above its long-term resistance today and closed above it. MSFT is now overbought on the daily chart RSI.
Based on the reduced volatility and the increasing rejection of large intraday moves in either direction, I will be looking to sell spreads in the opposite direction of large moves experienced in morning trading. I will begin looking for opportunities at 10 AM after Powell’s speech and the JOLT job openings report at 10 AM.
Sunday, June 30, 2024:
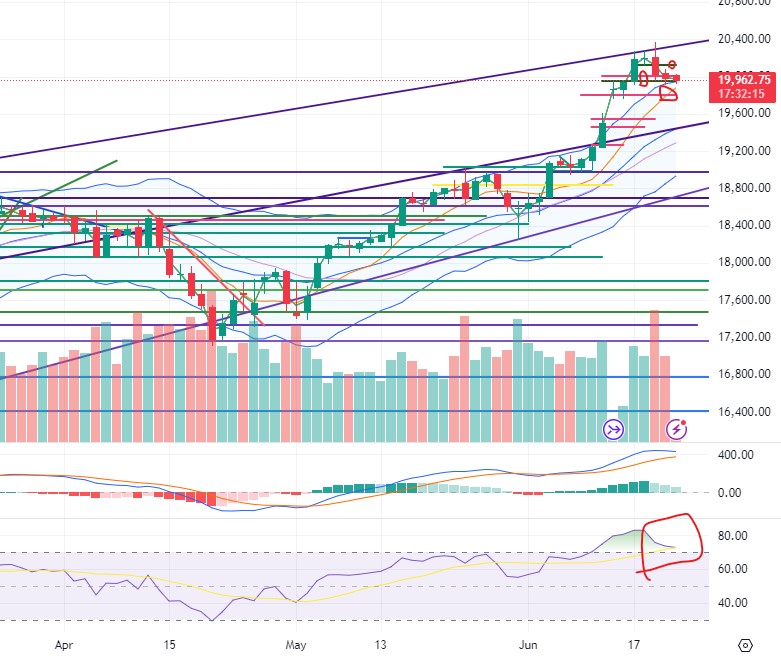
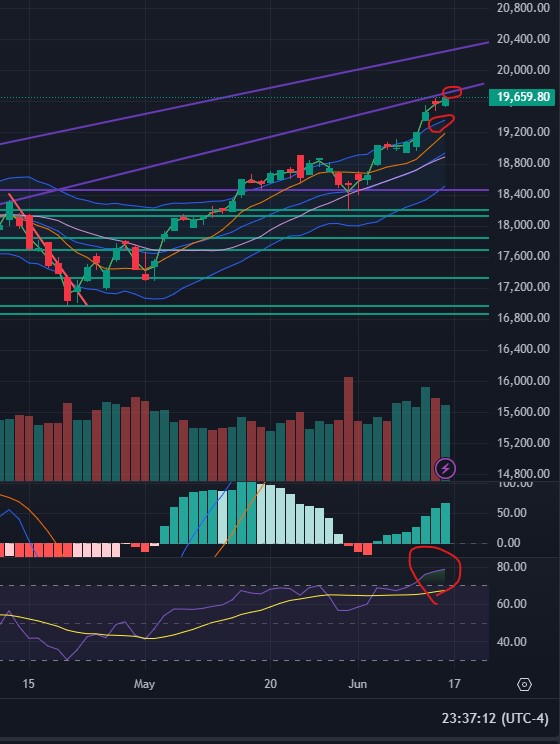
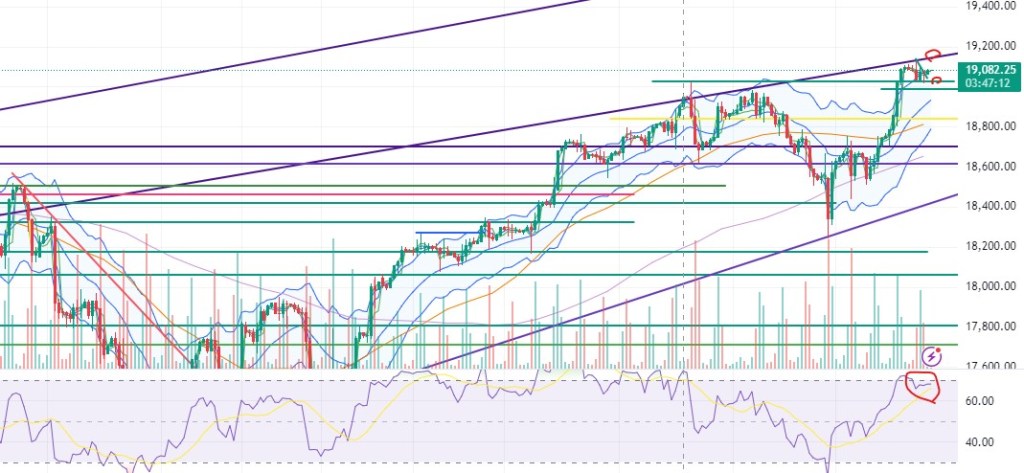
On Friday, the market broke through the $20,130 level before rejecting the $20,300 level and closing red at $19,933. The $20,300 level coincides with an important long-term resistance on NDX of $19,975, which was NDX’s prior ATH. On Friday, NDX briefly breached this level before the large drop and ended up closing at $19,679. Friday’s market action has now left a double top pattern on NDX’s daily chart. Both NDX and NQ are now again trading below their 9-day moving averages and are still close to overbought on the daily chart RSI.
NVDA pushed above the $125.50 resistance level but, like the market, ended up dropping and closing more than $2 below the $125.50 resistance. NVDA is still below its 9-day MA and is now touching its 21-day MA. AAPL traded down 1.64% and is now below its 9-day moving average again. MSFT had a similar day to NVDA; it broke above its long-term resistance before dropping down significantly and closing the day almost $7 below its long-term resistance and below its 9-day MA. MSFT is no longer overbought on the daily RSI chart.
I think a large move up is unlikely given the current double top pattern and that both the Nasdaq and its important components are trading below their 9-day MAs. I do think a large move down is possible. Going into tomorrow, I’m looking to sell bear call spreads on NQ with a strike as high above $20,130 as possible.
There is an important economic report being released tomorrow at 10:00 AM. I will be looking for opportunities to enter my position after the release of that report.
Thursday, June 27, 2024:
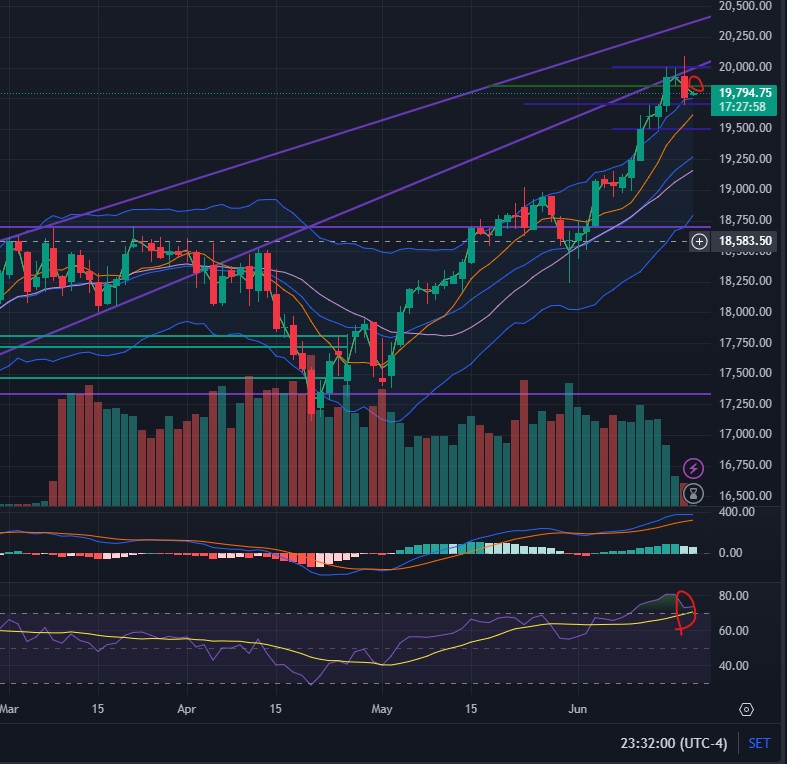
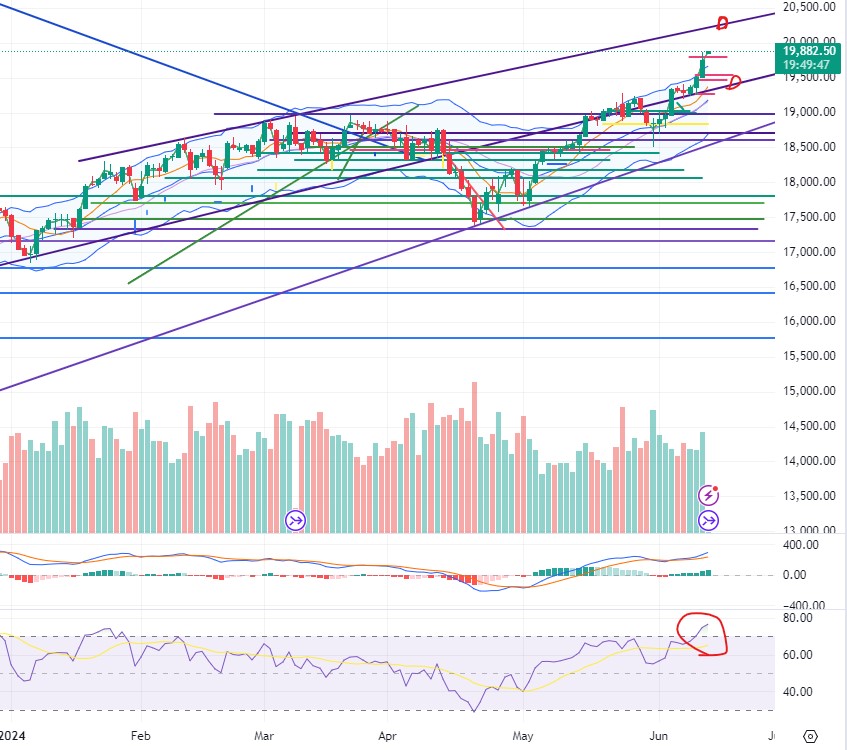
Today, the market traded in a range, bouncing between two of the levels identified yesterday: the $19,950 support and the $20,130 resistance. After the market closed, Trump and Biden had their presidential debate, which seemingly favored Trump. This led to an after-hours Nasdaq rally, and NQ is now trading right at its $20,130 resistance level and above both its 9-day and 21-day moving averages. NQ is still almost overbought on the Daily RSI chart, as is NDX. NDX is still trading at the upper Keltner channel line on the daily chart, indicating signs of excess short-term buying.
NVDA continues to trade just below its $125.50 resistance level and is trapped below its 9-day MA and above its 21-day MA. AAPL traded up slightly and continues to trade above its 9-day moving average and is almost oversold based on the daily chart RSI. MSFT broke above its long-term resistance today before dropping back to close just above its long-term resistance line. MSFT remains overbought on the daily RSI chart.
I think a large move up or down is unlikely tomorrow as volatility has been dropping, according to my volatility tracker. Going into tomorrow, I’d prefer to sell bear call spreads on NQ with a strike as high above $20,130 as possible. However, if I see the market clearly break and hold above that level, I will then look to sell bull put spreads with a short strike below $20,130.
There are two important economic reports being released tomorrow at 8:30 AM before the market opens and a third one being released at 9:45 AM. I will be looking for opportunities to enter my position after the release of the report at 9:45 AM.
NQ’s chart with levels and 1 Day chart RSI circled in red:
Wednesday, June 26, 2024:
Trading went well today; I was able to execute my plan from the night before. I waited until after the housing report was released at 10 AM and then waited for the market to signal a hold of the $19,950 support before selling bull put spreads. The market moved upwards shortly after I entered my trade, allowing me to close my position five minutes later with a profit of $350 ($3.5 per contract).
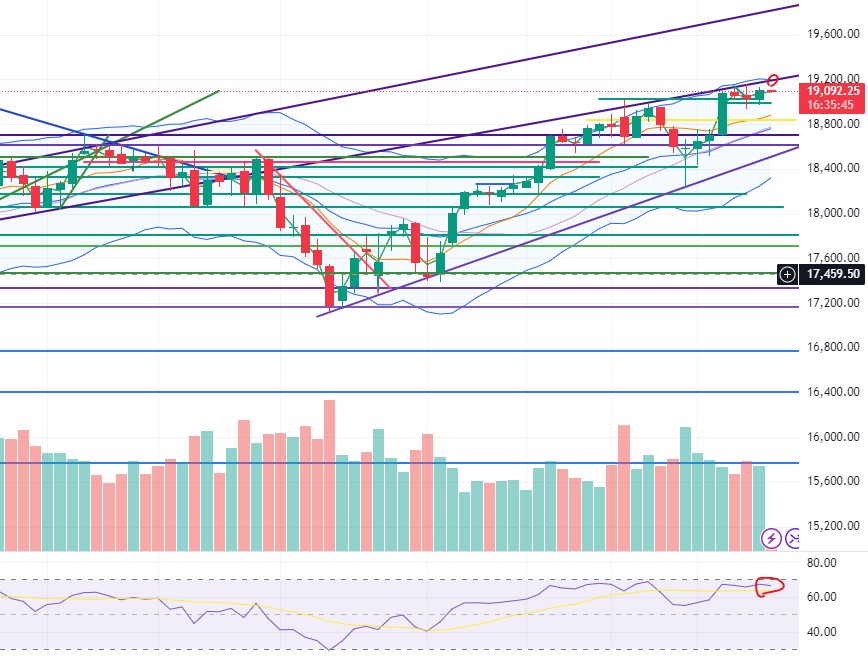
Today, the market traded in a tight range, bouncing between two of the levels identified yesterday: the $19,950 support and the $20,000 resistance. After market close, Micron (MU), a maker of memory chips, released its earnings. Although it beat on earnings, it did not beat on revenues, causing the stock and the Nasdaq to drop in after-hours trading. MU mentioned that its AI-focused memory chips are sold out until 2025 and that its data center business grew by over 50%. Despite the negative market reaction to its earnings, the company reaffirmed the general market consensus of a growth boom in AI.
NQ is now trading below its 9-day MA and below the $19,950 level, which is now a resistance. NQ is still almost overbought on the Daily RSI chart, as is NDX. NDX is now trading at the upper Keltner channel line on the daily chart, indicating signs of excess short-term buying. NVDA dropped in after-hours trading and is now trading below the $125.50 level mentioned yesterday. Today, NVDA touched its 9-day moving average and rejected it. AAPL had a positive day and is now trading $2 above its 9-day moving average and is almost oversold based on the daily chart RSI. MSFT moved up today and is again trading right at its long-term resistance and is overbought on the daily RSI chart.
The new home sales report released today showed that there are the most homes in inventory in the USA since the financial crisis. This is negative for the economy as it is likely to lead to less homebuilding economic activity. This, combined with the negative reaction to Micron’s earnings today, leads me to think that a large move downwards tomorrow isn’t unlikely. Given these two news items and that NQ, NDX, NVDA, and MSFT are all either at overbought levels or at resistance areas, I think a large move up is unlikely. Based on this, I will be looking to sell bear call spreads on NQ with a strike price as high above $19,950 as possible, preferably above $20,000.
There are three important economic reports being released tomorrow at 8:30 AM before the market opens. I will be looking for opportunities to enter my position between 9:15 AM and 9:45 AM.
NQ’s chart with levels and 1 Day chart RSI circled in red:
Tuesday, June 25, 2024:
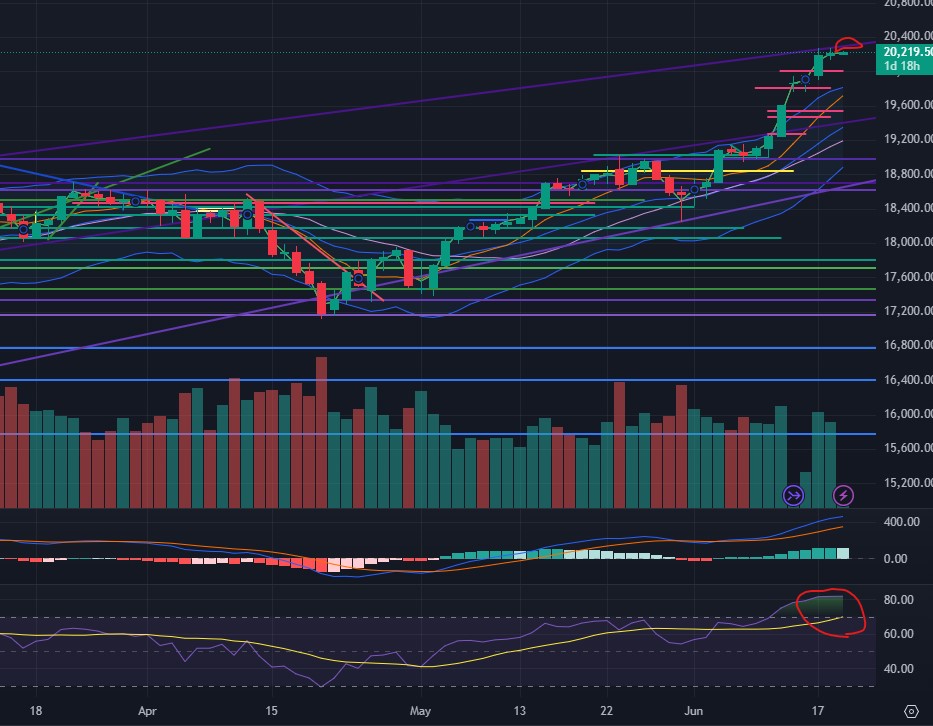
Today the Nasdaq Index ended the day more than 1% higher as NVDA bounced off of its support and brought the market up with it. The daily candle on NQ today formed a pattern that can signify a reversal from a pullback. Both NQ and NDX are now trading back above their 9 day moving average. NQ is currently trading in between a soft 15 minute chart support of $19,950 and a soft 1 hour chart resistance of $20,000. The $19,950 area also coincides with the 9 day moving average. The other key levels in proximity are a support at $19,800 and a resistance at $20,130. NQ is close to oversold on the 1 day chart and. NVDA moved up more than 5% today and is now trading above the strong support area of $125.50. NVDA is trading just $1 below its 9 day moving average. AAPL rejected its 9 day moving average today and is also trading below it. MSFT moved up today and again is trading right at its long term resistance
Based on the information above I believe a large move to either direction is unlikely. Going into tomorrow I will make my decision on which way to sell spreads based on how the market reacts in the morning when it touches the $20,000 level or the $19,950 level. I will be looking to sell bull put spreads on NQ with a short strike below $19,950 if NQ is able to hold convincingly above $20,000 and sell bear call spreads above $20,000 if NQ breaks convincingly below $19,950.
The New Home Sales report will be released tomorrow at 10 AM, so I will wait until after this report is released to enter any trades.
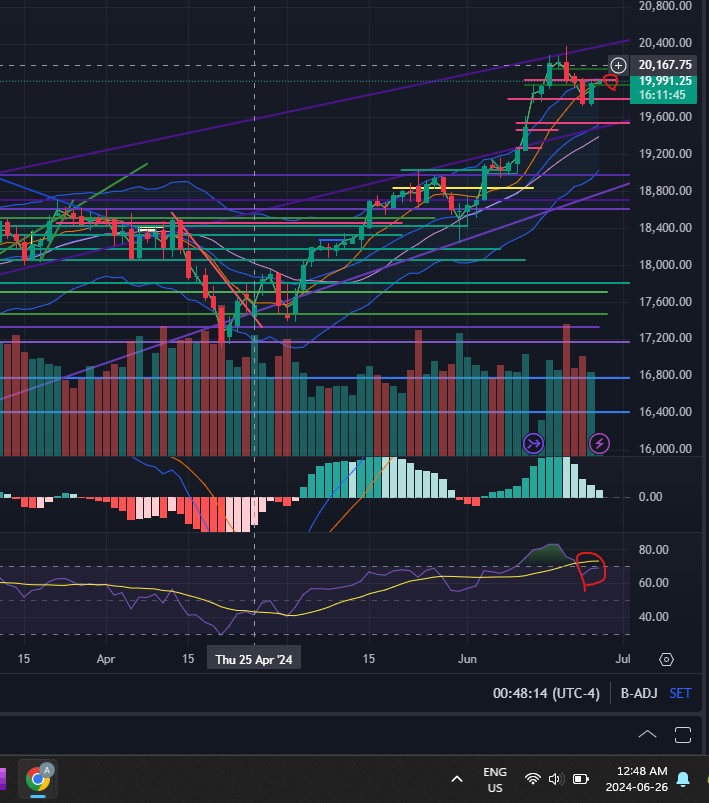
NQ’s chart with levels and 1 Day chart RSI circled in red:
Monday June 24th, 2024:
Today the market ended the day more than 1% lower as NVDA continued its correction. NDX and NVDA are now both trading back within their kelter channels. Both NQ and NDX are now trading below their 9 day moving average and above their 21 day moving average. NQ is currently trading right at a soft 15 minute support of $19,800. The other key levels in proximity are a support at $19,550 and a resistance at $19,950. NQ and NDX are both no longer overbought on the 1 day chart. NQ is now close to oversold on the 4 hour chart and NVDA is oversold on its 4 hour chart. NVDA is trading less than a dollar away from its next big support area. AAPL closed the day almost flat and MSFT again bounced lower off its long term resistance.
Based on the fact that NQ and NVDA are both near oversold on the 4 hour chart and that both are at a support level, makes a move up seem more likely. Although a move up seems more likely, I will primarily base my trade tomorrow on whether NQ holds above or breaks below the $19,800 level in early trading. Going into tomorrow I will be looking to sell bull put spreads on NQ with a short strike as far below $19,800 as possible.
An important consumer confidence report will be released tomorrow at 10 AM, so I will wait until after this report is released to enter any trades.
NQ’s chart with levels and 4 Hour chart RSI circled in red:
Sunday June 23rd, 2024:
On Friday the market ended the day slightly lower than it opened. This caused the “3 day Open to Close moving average” volatility indicator that I measure in my Volatility Tracker page, to move significantly below the 5 day moving average. This might be a sign that volatility may begin to diminish. This is something I’ll keep in mind when determining how conservative to be when entering trades the next few days.
NQ is currently trading right at a soft 15 minute support of $19,950. The other key levels in proximity are a support at $19,800 which also happens to be the 9 day moving average and a resistance of $20,000 and $20,130. NQ and NDX are both still overbought on the 1 day chart and trading outside the upper kelter channel. NVDA, had traded above its upper kelter channel for 18 days until it finally dropped more than 9% from Thursday open to Friday close and is now back within its kelter channel. NVDA is still close to overbought on the 1 day chart. AAPL has convincingly come off of its $220 high and is around $10 away from its next support. MSFT is again at its long term resistance and overbought on the daily and on the 4 hour.
Based on the information above I believe a large move to either direction is unlikely. That being said, the fact that NDX rejected its long term resistance at $19,850 and that both NQ and NDX are still overbought on the daily chart and trading outside the upper kelter channel makes me believe that a move to the downside is more likely than a move to the upside. NVDA having come back to within its kelter channel on the daily chart makes me feel that the likelihood that NQ and NDX also return to within their kelter channels is more likely. Going into tomorrow I will be looking to sell bear call spreads on NQ with a short strike as high above $19,950 as possible.
There are no important economic or earnings releases tomorrow so I will be looking to enter my trade between 9:15 AM and 9:45 AM.
NQ’s chart with levels and 1 Day chart RSI circled in red:
Thursday June 20th, 2024:
Trading went well today. I sold bear call spreads right before the market opened. NQ dropped in the first minute of trading and I was able to close out my position with a $350 profit, 12 minutes after I opened it.
Today NQ dropped convincingly below its $20,275 long term resistance level, which is the upper line of a long term channel that NQ has traded in in the past. It now trades only $60 away from a soft support level of $20,000 and only $70 below the soft resistance of $20,130. NDX also closed below its $19,800 level. MSFT dropped to its 9 day moving average and rejected it, closing the day almost where it opened. AAPL fell more than $4 and is now trading close to its 9 day moving average. NVDA broke above its ATH and then crashed down more than $10. The stock is now trading right at its upper kelter channel on the daily chart after 18 daily candles outside the upper kelter channel. NQ and NDX are both overbought based on the RSI on their 1 day charts. NDX has now traded outside of its upper Kelter channel for the last 6 days. Trading outside of the upper kelter channel is a potential sign of extreme unsustainable (in the short term) buying.
Based on the information above I think a large move up is unlikely. A large move down seems possible but not as likely given today’s slight drawdown. Given how NDX and NVDA are still trading outside their kelter channels and that they are both overbought on the 1 day chart I will still be primarily looking to sell bear call spreads tomorrow. For tomorrow I will be looking to sell option spreads on the NQ contract expiring on June 21 as it is still more liquid than the one expiring in September. I’ll be looking to sell bear call spreads with a short strike as high above $19,850 as possible ($19,850 is a resistance level equivalent to the soft resistance of $20,130 on the September contract). There are 3 economic reports that could cause volatility being released Thursday between 9:45 and 10 AM, for that reason I will wait until 10 AM to open my position.
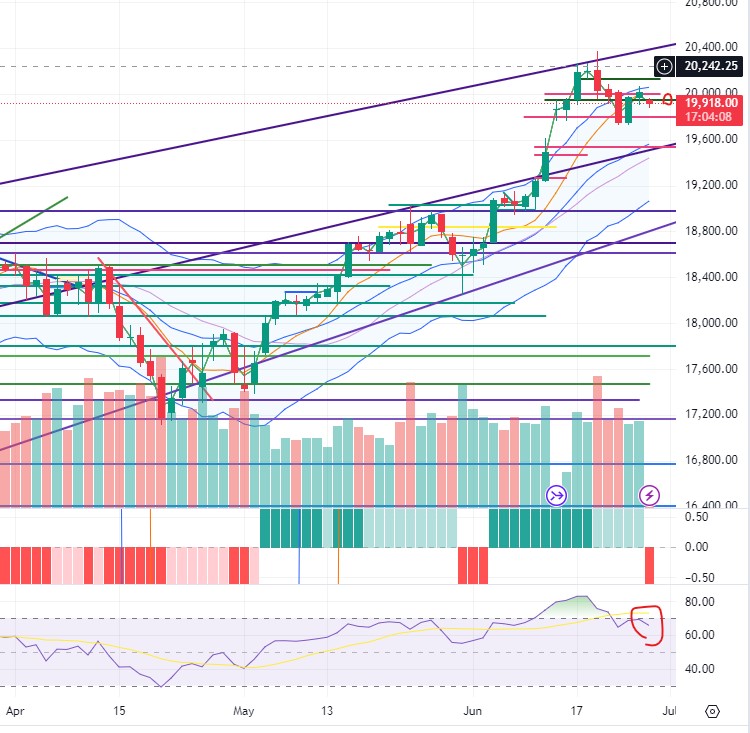
NQ’s chart with the Resistance and 1 Day chart RSI circled in red:
Tuesday, June 18th, 2024:
Today NQ touched and softly rejected its $20,275 long term resistance level, which is the upper line of a long term channel that NQ has traded in in the past. It now trades only $50 away from this level. NDX remains convincingly above its $19,800 support level. MSFT touched its long term resistance level of $450 and rejected it, closing the day almost $4 lower than that. AAPL also fell after coming close to its all time high today. AAPL touched $219 but closed the day almost $5 lower. NVDA is overbought on all 3 charts and has 18 daily candles outside the upper kelter channel. NQ and NDX are both overbought based on the RSI on their 4 hour and 1 day charts. NDX has now traded outside of its upper Kelter channel for the last 5 days. Trading outside of the upper kelter channel is a potential sign of extreme unsustainable (in the short term) buying.
Based on the information above I think a large move up is unlikely. A large move down sometime soon doesn’t seem unlikely given how NQ, NDX and its largest components are all overbought from an RSI perspective. The fact that NDX has traded outside its upper kelter channel for the last 5 days also increases the possibility of a pullback at some point soon. Finally NQ trading just below its long term resistance of $20,275 after having rejected today also increases the likelihood of a small pullback. With this in mind I’ll be looking to sell bear call spreads on Thursday with a short strike as high above $20,275 as possible. There are 3 economic reports that could cause volatility being released Thursday before the market opens, for that reason I will wait until the market opens to enter my position.
Wednesday is a holiday so this analysis is for my trading on Thursday. Thursday will be my first real money trades documented here. See my Real Money Trading Begins post.
NQ’s chart with the Resistance and 1 Day chart RSI circled in red:
Monday, June 17th, 2024:
NQ breached its $20,200 resistance level during the day but ended up rejecting it and closing the day below that level. NDX on the other hand breached its $19750 resistance level and held convincingly above that level. MSFT touched its long term resistance level of $450 and rejected it, closing the day slightly lower than that. AAPL had a positive day and could be setting up to attempt a run at a new ATH. NQ and NDX are both overbought based on the RSI on their 1 hour, 4 hour and 1 day charts. NDX has now traded outside of its upper Kelter channel for the last 4 days. Trading outside of the upper kelter channel is a potential sign of extreme unsustainable (in the short term) buying.
Based on the information above and the fact that the only important economic report being released tomorrow is a retail sales report, I think a large move up is unlikely. A large move down sometime soon doesn’t seem unlikely given how NQ, NDX and its largest components are all overbought from an RSI perspective. The fact that NDX has traded outside its upper kelter channel for the last 4 days also increases the possibility of a pullback at some point soon. Finally NQ trading just below its long term resistance of $20,200 after having rejected it today also increases the likelihood of a small pullback. With this in mind I’ll be looking to sell bear call spreads tomorrow with a short strike as high above $20,270 as possible. I will wait until close to market open to enter my position.
NQ’s chart with the Resistance and 1 Day chart RSI circled in red:
Sunday, June 16th, 2024:
On Friday NQ traded between its $19,800 and $20,000 levels identified earlier. NQ remains overbought based on the RSI on both its 4 hour and 1 day charts. NDX is overbought on the 4 hour and 1 day charts as well and has traded outside of its upper Kelter channel for the last 3 days. Trading outside of the upper kelter channel is a potential sign of extreme unsustainable (in the short term) buying. NDX also remains just below its long term resistance
NVDA has broken out convincingly from its prior ATH resistance. NVDA is also overbought on the 4 hour and 1 day charts. AAPL also remains significantly above its prior ATH which served as a resistance up until last week when AAPL made a large move past it. AAPL’s 4 hour and 1 day charts are also overbought based on RSI. MSFT is approaching its long term resistance and its 4 hour and 1 day charts are also in overbought territory.
Based on the information above and the fact that there are no important economic reports or earnings releases tomorrow, I think a large move up is unlikely. A large move down sometime soon doesn’t seem unlikely given how NQ, NDX and its largest components are all overbought from an RSI perspective on the 4 hour and 1 day chart. The fact that NDX has traded outside its upper kelter channel for the last 3 days also increases the possibility of a pullback at some point soon. With this in mind I’ll be looking to sell bear call spreads tomorrow with a short strike as high above $20,000 as possible. I will wait until close to market open to enter my position.
NDX’s chart with the Resistance, Upper Kelter Channel, and 1 Day chart RSI circled in red:
Thursday June 13th, 2024:
Today NQ finished the day up around 0.5% on the a continuation of yesterday’s rally. NQ tested and rejected its support at $19,800 around 10 AM and 12 PM today. The fact that it tested the level twice is more bearish than bullish, especially considering that the bounces after reaching that level weren’t great. NDX hit its long term resistance line and pulled back slightly off of it. Both NDX and NQ are now trading in overbought territory on the 4 hour and 1 day charts based on their RSIs.
As for the important Nasdaq stocks, NVDA made a new ATH today and AAPL continues to trade convincingly above its prior ATH that it broke out from this week. That being said both NVDA and AAPL are now in overbought territory on their 4 hour and 1 day charts based on their RSIs.
Going into tomorrow I think a large move up is unlikely given how much the market has already climbed this week and because their are no economic reports or important earnings reports due in the pre-market session. I also don’t think a large move down is likely, but it is more likely than a large move up. With that in mind I still don’t think it’s likely for NQ’s $19,300 support to be broken or for the $20,200 resistance to be broken. Given the overbought RSIs on NQ, NDX, AAPL and NVDA as well as NDX’s rejection of its long term resistance, If NQ approaches the $20,000 level, I will be looking to sell $40 bear call spreads with a short strike above the $20,000 phycological resistance. If instead NQ comes down to its $19,800 support and clearly holds that level, then I will be looking to sell bull put spreads with a short strike below $19,800. I will look to wait for a move up or down right before or right after the market opens to enter my position.
Wednesday June 12th, 2024:
I did not place any trades today, keeping in accordance with my “Trading Strategy”. I don’t trade on days when Fed interest rate decisions are being made as they tend to be too volatile. This decision was validated today as the Nasdaq rallied more than 1.3%, exemplifying an unusually volatile day. The rally came as the Fed held interest rates but said they would likely be cutting rates once this year. Yields on US 10-year treasuries dropped more than 0.1% today in relation to the FOMC decision and guidance. NQ broke out from its strong resistance around the $19,200 area and is now trading convincingly above that area and is now in the middle of a channel I have marked in a picture below. NDX (Nasdaq Index) however reached a level just below its long term resistance. Both NDX and NQ are now trading in overbought territory on the 1 hour, 4 hour and 1 day charts.
NVDA touched its ATH and retreated slightly. MSFT reached its long term resistance and retreated slightly after reaching it. AAPL has convincingly broken out from its prior ATH and is now almost 10% above its prior ATH. AVGO reported earnings after hours today and announced a 10-1 stock split as well as earnings that were better than expected. Broadcom (AVGO) is a chipmaker, and the products their chips go in have seen increased usage due to the AI boom. The stock is up more than 14% in after hours. This might propel today’s rally to continue tomorrow even though Nasdaq is overbought from an RSI perspective.
Going into tomorrow I think a large move to either direction is more possible than usual given that it is the day following an FOMC rate decision and that there are a few inflation and job growth related economic reports being released at 8:30 AM tomorrow. With that in mind I still don’t think it’s likely for NQ’s $19,300 support to be broken or for the $20,200 resistance to be broken. If NQ holds above the soft 15 minute chart support of $19,800 I will be looking to sell $40 bull put spreads with a short strike below the $19,800 support. If that support is broken convincingly then I will look to sell bear call spreads with a short strike as high above $19,800 as possible. I will look to wait for a move up or down right before or right after the market opens to enter my position. I will be watching NVDA closely to see if it has a sympathy rally based on AVGO’s results, if it does this will make me feel more confident in selling bull put spreads.
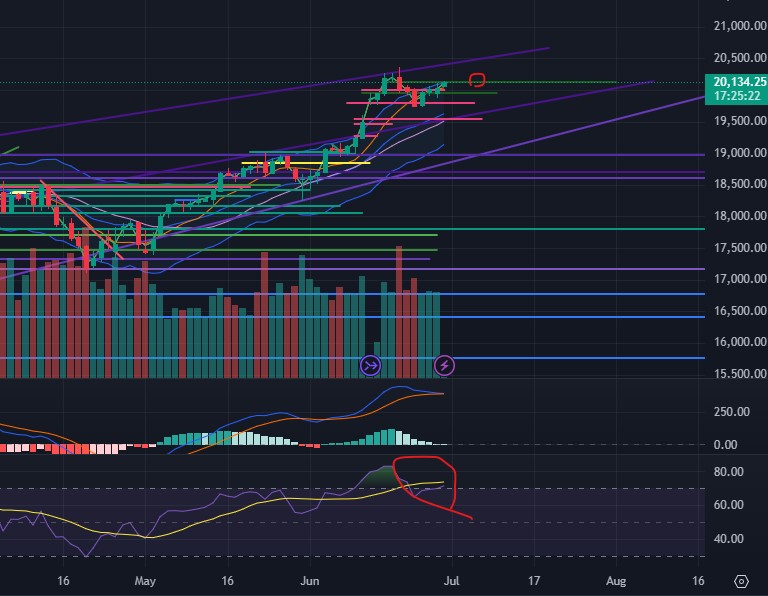
NQ’s chart with the Resistance, support, 1 Day chart RSI, and RSI MA circled in red:
Tuesday June 11th, 2024:
Tomorrow I will not be trading as FOMC rate decision days tend to have elevated volatility and the implied volatility of options doesn’t drop during the first hour of trading like it does on most other trading days.
Monday June 10th, 2024:
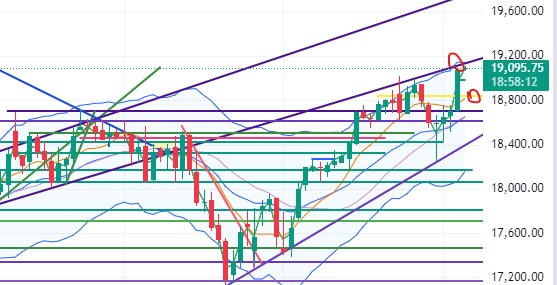
Going into tomorrow NQ is trading between the soft resistance at $19,025 and the hard resistance line at $19,190. There are no important earnings releases tomorrow and no important economic reports being released pre market either. The 1 hour and 4 hour charts are still close to overbought in the RSI with the RSI Moving average above the current RSI, suggesting decreasing buying pressure. The 1 day chart is also close to overbought but in this on the RSI MA is slightly below the RSI suggesting the potential for further upward momentum. Seeing as the FOMC is making its rate decision on Wednesday and there are no important pre scheduled economic or earnings reports for tomorrow, I think a large move to either direction is unlikely.
As for AAPL, MSFT, NVDA, TSLA and NFLX, AAPL had a noteworthy day dropping almost 2% and marking a clear rejection of the ATH resistance. AAPL’s next support area is $190, suggesting it could drop another 1.5% or so. NVDA had a muted response to its post stock split trading and closed the day up 0.75%.
Given the information above, a large move towards either direction looks unlikely, but a large move lower on the back of AAPL’s drawdown seems more possible then a large move upwards that breaks the market out to all time highs. Based on this I will be looking to sell $40 bear call spreads on NQ with a short strike as close to the $19,190 resistance as possible. I will look to wait for a move up right before or right after the market opens to enter my position.
NQ’s chart with the Resistance, 1 DAY chart RSI, and RSI MA circled in red:
Sunday June 9th, 2024:
Going into tomorrow, NQ is still trading above a support on the 15 minute chart of $19025 and still below the strong resistance on the 1 day chart of around $19,175. NQ rejected the resistance line on both Thursday and Friday, but Friday the drop after the rejection was larger, signaling that selling in that area has intensified and not diminished. This might mean NQ needs a larger drop before coming back to retest ATHs. NQ is close to overbought on the 1 week, 1 day and 4 hour chart RSIs. However on the 4 hour chart the RSI Moving Average is now above the RSI and sloping down, signaling a potential decrease in buying pressure on the 4 hour time frame.
There are no economic reports set to be released tomorrow but the FOMC is making their interest rate decision on Wednesday. Given that both the EU and Canada dropped rates this week, the market is unlikely to make a large move before the rate decision on Wednesday.
As for AAPL, MSFT, NVDA, TSLA and NFLX, the only one worth mentioning for Monday is NVDA. The stock is still above the support identified on Thursday and it has no real resistance until close to the $1,500 region (or $150 post stock split). NVDA will begin trading post stock split on Monday. If the market’s reaction to seeing NVDA’s stock at the $120 region is very positive or very negative, that could cause a large move for NQ.
Based mainly on the progressive rejection of the NQ resistance line, I am primarily looking to sell bear call spreads with a short strike as close to the $19,175 resistance as possible. The goal is to sell a $40-spread with a $10 premium, that is as close to or above the $19,175 resistance line as possible. I will try to enter the trade right before or right after the market opens.
NQ’s chart with the Resistance, 4 Hour chart RSI, and RSI MA circled in red:
Thursday June 6th, 2024:
Going into tomorrow, NQ is trading above a support line on the 15 minute chart of $19025 and still below the strong resistance on the 1 day chart of around $19,150. NQ’s RSI is signaling close to oversold on both the 4H and the 1 day chart, but the RSI moving average line is still below the RSI signaling potential continued strength. NVDA had a slight pull back today and is trading around $40 away from its next support. AAPL rejected its ATH resistance line that was mentioned yesterday and also pulled back slightly today. Tomorrow morning there are 3 important employment and wage inflation related reports set to come out at 8:30 AM. As long as not all reports are negative or positive for the market, I think a large move tomorrow is unlikely as the market is likely to continue to consolidate in this area. I think a large move up however is more likely than a large move down, so I’d prefer to sell bull put spreads if possible. Based on the $19,025 support I’ve identified, I’ll be looking to sell bull put spreads with a short strike of $18,980 or lower if possible. If however we get a large move up in the morning, I’ll wait for the first pullback and consider selling bear call spreads with a short strike above the $19,150 resistance identified.
NQ’s chart with the Resistance, support and RSI circled in red:
Wednesday June 5th, 2024:
The Nasdaq futures rallied almost 2% today likely due to HPE’s earnings which again re-iterated the extreme demand for AI. The company beat earnings due to growth in demand for its AI servers which are equipped with NVDA chips. This news likely triggered NVDA’s continued rally, helping push NVDA up more than 5% on the on the day. The second piece of positive news was Canada dropping it’s interest rates, this along with a weaker employment report than expected likely drove traders to increase their expectations for the FED to cut rates sooner.
Going into tomorrow NQ is closely approaching a support line that supported the market’s rally from January through to April when the market experienced a pull back. This line has now served as a resistance earlier this month. The NDX has more room to run before reaching its next big resistance. QQQ is in a similar spot as NQ, with the same resistance line as NQ being $4 away from it’s price at end of day today. All 3 of the Nasdaq instruments are overbought on the daily and 4 hour RSI. AAPL is at its all time high resistance, and NVDA has broken out and has no clear resistance for a while. Based on the large rally today, the overbought RSI for Nasdaq, and the fact that NQ and QQQ are very close to an important resistance line, I think a large move up tomorrow is unlikely, while a small move down seems likely and a large move down seems possible but not likely. The initial jobless claims numbers will be released at 8:30 AM. Pending the market’s reaction to this, I will be looking to sell $40 bear call spreads as high above NQ’s $19150 resistance as I can while still collecting $10 in premium per spread. And will be looking to close out my position if and when NQ approaches the soft $18985 support identified on the 15 minute chart. All Spreads are always sold using options with same day expiration.
NQ’s chart with the Resistance and support circled in red: